Fayl:Binary logarithm plot with ticks.svg

Size of this PNG preview of this SVG file: 408 × 325 pixels. Başqa çözüm: 301 × 240 pixels | 603 × 480 pixels | 964 × 768 pixels | 1.280 × 1.020 pixels | 2.560 × 2.039 pixels.
Kerçek fayl (SVG faylı, nominal 408 × 325 piksel, fayl büyükligi: 56 KB)
Faylğa ait qısqa tarif
| Tasvir |
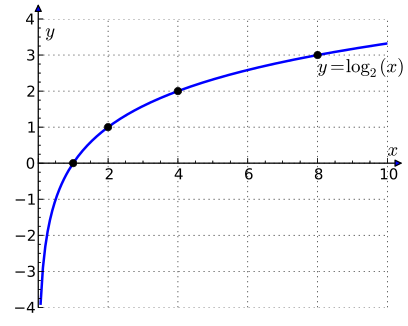
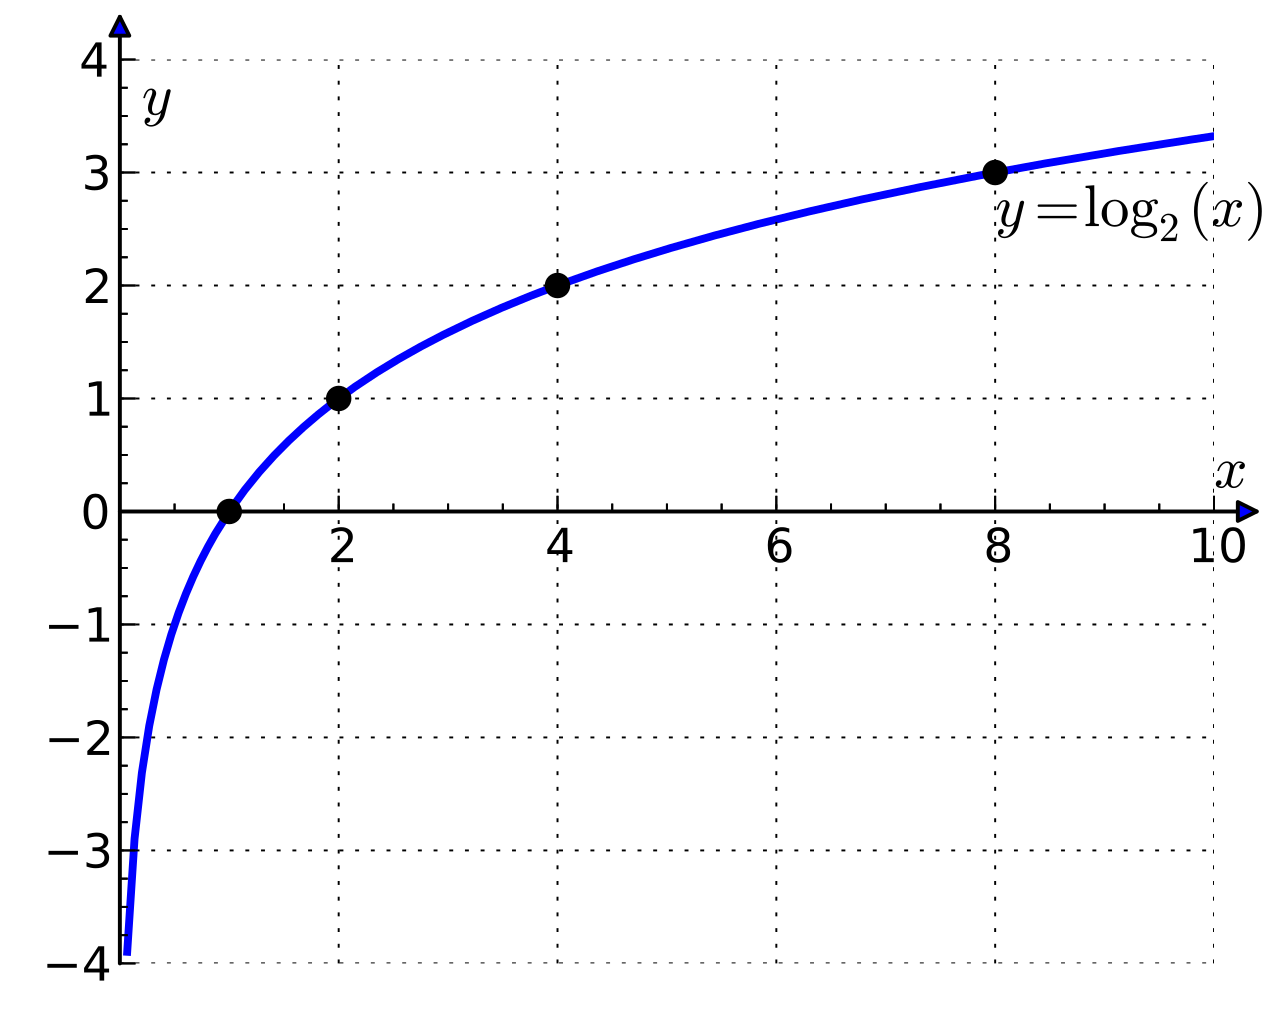
English: Binary logarithm plot with ticks. |
||
| Tarih | |||
| Menba | Öz işi | ||
| Yaratıcı | Krishnavedala | ||
| Other versions | File:Binary_logarithm_plot_with_ticks.png | ||
| SVG genesis | This plot was created with Matplotlib. | ||
| Source code | Python code
|
Litsenziyalama
I, the copyright holder of this work, hereby publish it under the following licenses:
This file is licensed under the Creative Commons Attribution-Share Alike 3.0 Unported license.
- Azatsıñız:
- paylaşuv – qopyaluv, dağıtuv ve iletüv
- remiks etüv – uyğunlaştıruv
- Bu şartlar astında:
- attribution – You must give appropriate credit, provide a link to the license, and indicate if changes were made. You may do so in any reasonable manner, but not in any way that suggests the licensor endorses you or your use.
- aynı şekilde paylaşuv – If you remix, transform, or build upon the material, you must distribute your contributions under the same or compatible license as the original.

|
Permission is granted to copy, distribute and/or modify this document under the terms of the GNU Free Documentation License, Version 1.2 or any later version published by the Free Software Foundation; with no Invariant Sections, no Front-Cover Texts, and no Back-Cover Texts. A copy of the license is included in the section entitled GNU Free Documentation License. |
İstedigiñiz lisansnı seçebilirsiñiz.
Faylnıñ keçmişi
Faylnıñ kerekli anki alını körmek içün tarihqa/saatqa basıñız.
| Tarih ve saat | Kiçik resim | En × boy | Qullanıcı | İzaat | |
|---|---|---|---|---|---|
| şimdiki | 22:51, 2011 s. iyünniñ 5 | | 408 × 325 (56 KB) | Krishnavedala | removed one '0' at the origin and kept the texts big enough like the previous edit |
| 15:13, 2011 s. iyünniñ 5 |  | 408 × 325 (76 KB) | JohnBlackburne | Make axis labels bigger and clearer, so readable at thumbnail size | |
| 09:59, 2011 s. iyünniñ 5 |  | 408 × 325 (56 KB) | Krishnavedala | {{Information |Description ={{en|1=Binary logarithm plot with ticks. Created using python. <syntaxhighlight lang="python"> from numpy import linspace,log2 from matplotlib.pyplot import * from mpl_toolkits.axes_grid |
Fayl qullanıluvı
Bu saife qullana bu fayldı:
Umumiy fayl qullanıluvı
Bu vikilerde bu fayldı qullana:
- as.wikipedia.org qullanım
- ba.wikipedia.org qullanım
- be-tarask.wikipedia.org qullanım
- be.wikipedia.org qullanım
- bg.wikipedia.org qullanım
- bn.wikipedia.org qullanım
- bs.wikipedia.org qullanım
- bxr.wikipedia.org qullanım
- ca.wikipedia.org qullanım
- ckb.wikipedia.org qullanım
- cv.wikipedia.org qullanım
- cy.wikipedia.org qullanım
- de.wikibooks.org qullanım
- Mathematrix: AT BRP/ Theorie/ Reifeniveau 4
- Mathematrix: MA TER/ Theorie/ Funktionen
- Mathematrix: AT BRP/ Theorie nach Thema/ Funktionen
- Mathematrix: AT AHS/ Theorie nach Thema/ Funktionen
- Mathematrix: AT AHS/ Theorie/ Klasse 6
- Mathematrix: BY GYM/ Theorie/ Klasse 10
- Mathematrix: BY GYM/ Theorie nach Thema/ Funktionen
- diq.wikipedia.org qullanım
- el.wikipedia.org qullanım
- eml.wikipedia.org qullanım
- en.wikipedia.org qullanım
- en.wikibooks.org qullanım
- et.wikipedia.org qullanım
- fa.wikipedia.org qullanım
- fi.wikipedia.org qullanım
- fo.wikipedia.org qullanım
- gl.wikipedia.org qullanım
- hy.wikipedia.org qullanım
- id.wikipedia.org qullanım
- it.wikipedia.org qullanım
- ko.wikipedia.org qullanım
- lmo.wikipedia.org qullanım
- lt.wikipedia.org qullanım
- mk.wikipedia.org qullanım
- ml.wikipedia.org qullanım
- ms.wikipedia.org qullanım
- pl.wikipedia.org qullanım
View more global usage of this file.